commercebuild Success Portal commercebuild Success Portal

  • Home
  • Submit a Ticket
  • Updates
  • Login
  • Contact Us
Home / Troubleshooting / How to View the Console in Chrome

How to View the Console in Chrome

1149 views Less than a minute 0

If there is an issue with a site — for example, a button you click does not lead to the expected result or action — the browser Developer Tools can be very useful in determining what the cause is. Specifically, the “Console” within the browser Developer Tools often provides useful information.

To access it, first right-click in the window where you’re experiencing the issue.

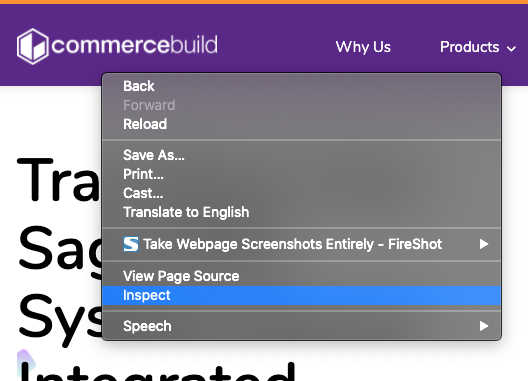
You should see a window appear, and it is usually docked within the browser. In that window, click the Console tab.

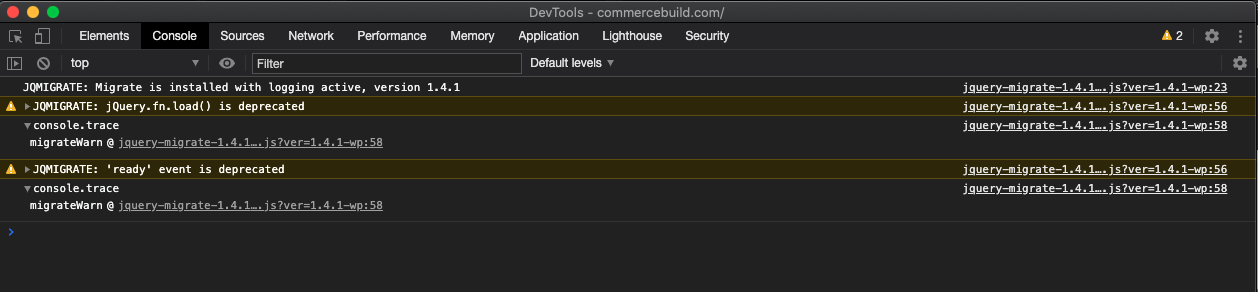
Generally, severe errors are highlighted in red. If you have any questions about the errors you see here, please take a screenshot and forward it to the Customer Success team for further assistance.

webstore Troubleshooting

About Bradly Hale

View all posts by Bradly Hale →

Related Articles

  • Error when adding a new user: Email is already in use
  • System Notification: Product is no longer available
  • How to Check a Price in Sage 300
  • General troubleshooting of display issues

Popular Articles

  • Enable Firewall Rules and a JavaScript Browser Challenge 2247 16
  • Enable Cloudflare Rate Limiting 2134 0
  • How to Add a JavaScript Snippet 1994 8
  • IP Allowlist 1945 0
  • Signing up for Cloudflare and Configuring Your Domain 1812 4

New Articles

  • Error when adding a new user: Email is already in use 676 0
  • How to Check commercebuild Payments Version 913 0
  • How to Enable reCAPTCHA on Custom Forms 820 0
  • Manually posting an order 970 0
  • Adding a custom message to the shipping step at checkout 785 0
© commercebuild 2022. All rights reserved.